
Trading commodity futures and options involves substantial risk of loss and is not suitable for all investors. You should carefully consider whether trading is suitable for you in light of your circumstances, knowledge and financial resources.
By: Rick Alexander, senior broker at Zaner Group.
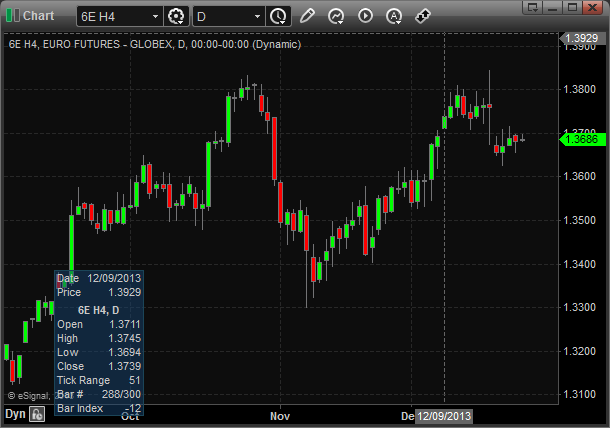
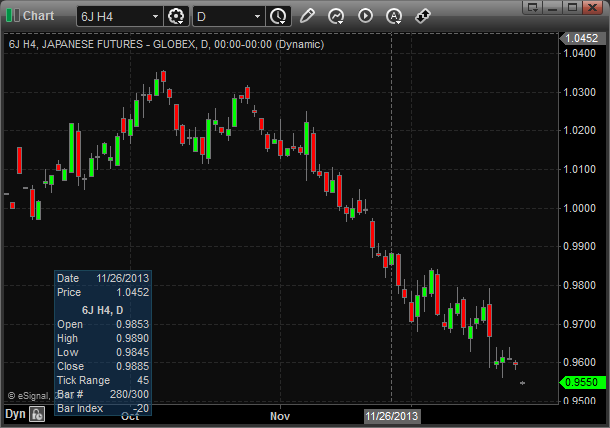
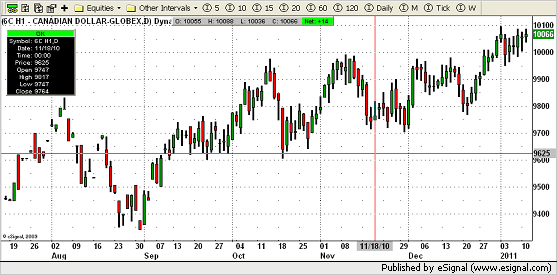
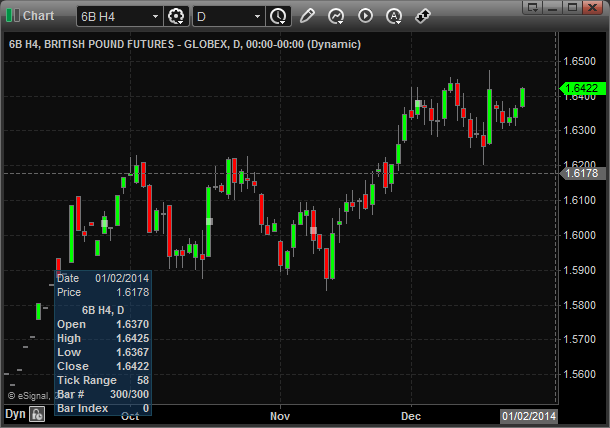
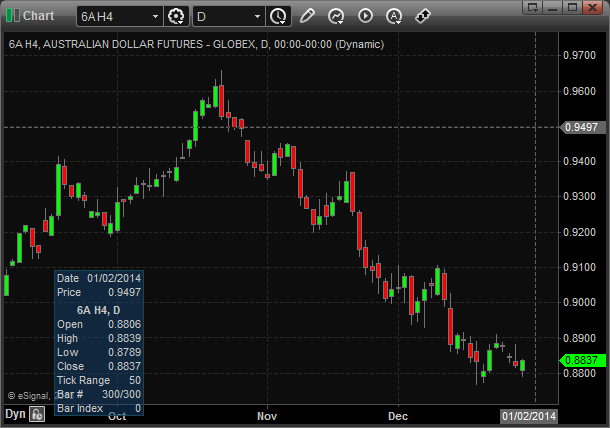
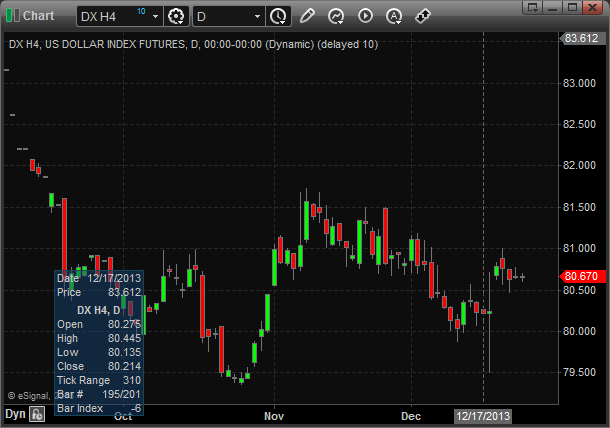
CURRENCIES: 5/15/12 Higher closes yesterday for the U.S. dollar index, Japanese Yen and British Pound futures while lower for the Canadian Dollar and Aussie Dollar, Euro Fx and Swiss Franc futures. The dollar as given me a BUY SIGNAL by closing over 8050 and following through higher again for its eleventh session in a row making its best high and close since the middle of March once again which should be a record for consecutive higher closes. THE DOLLAR HAS OBVIOUSLY BEEN MOVING HIGHER DUE TO THE HOPE THAT IT’S AS SAFE A HAVEN AS YOU CAN GET CONSIDERING THE FINANCIAL TURMOIL GOING ON IN MANY GOVERNMENTS AROUND THE WORLD. OF course, the USA is in no ‘great shakes’ as we already know! Also, the dollar has been trending higher since its reversal type action on May 1st. The Euro and franc settled lower both making their lowest lows and closes since the middle of January which is understandable considering the dollar has been moving higher during this same period of time. Finally, I’m giving a SELL SIGNAL for the franc since it closed below 10725. The yen continues to look higher for the present ending up slightly higher again with good support from 122 down to 120 and little resistance nearby but needs to soon breakout of its consolidation over the past week. The Important prices to watch are 12400 and 12600. The Canadian Dollar made its lowest close since April 11th. The 9900 area is an important to watch in my opinion. There is very strong support from 10100 down to 9950 which is now being tested at the lower end as shown below. The pound made its worst low in over three weeks before settling higher in reversal type action. There’s good support from 160 down to 156 at this time. The Aussie Dollar continues to look lower overall with very strong resistance that goes from 10200 to 10400 and even up to 10650 as seen below. Meanwhile, it made its worst low and close since the middle of December. For additional customizable charts and quotes visit Markethead.com for a FREE, no-obligation 30 day subscription. BUY SIGNALS FOR THE U.S. DOLLAR INDEX, JAPANESE YEN, BRITISH POUND AND CANADIAN DOLLAR FUTURES. SELL SIGNALS FOR THE EURO FX, SWISS FRANC AND AUSSIE DOLLAR. CALL FOR DETAILS AT (312) 277-0107 OR EMAIL ralexander@zaner.com!

Rick Alexander
(312) 277-0107
Subscribe FREE to Zaner Group’s Daily Research Newsletter.
Futures, options and forex trading is speculative in nature and involves substantial risk of loss. All known news and events have already been factored into the price of the underlying commodities discussed.
- Rick Alexander’s Meat futures commentary (5/14)
- Metal complex tumbles, Gold futures generate a sell signal (5/11)
- Wheat futures issue a sell signal (5/09)
- Rick Alexander’s Stock Index futures commentary (5/15)
- Soybean Meal futures show a fresh buy signal (5/10)
- USDA Crop Report Quick View (5/10)
- Rick Alexander’s Financial futures commentary (5/15)
- Rick Alexander’s Grain futures commentary (5/15)
- Heating Oil & Gasoline RBOB show sell signals (5/14)
- Rick Alexander’s Softs futures commentary (5/15)
- Live Cattle & Feeder Cattle futures give buy signals (5/15)
- Rick Alexander’s Metal futures commentary (5/15)
- Rick Alexander’s Crude Oil futures commentary (5/15)
- Markethead: Quotes, charts, news, commentary and more


Judy Crawford’s Softs futures Market Update (5/16)
Trading commodity futures and options involves substantial risk of loss and is not suitable for all investors. You should carefully consider whether trading is suitable for you in light of your circumstances, knowledge and financial resources.
By: Judy Crawford, senior broker at Zaner Group.
SOFTS FUTURES COMMENTS
JULY COTTON: It formed an inside day yesterday on the daily chart and triggered a buy today. It is in support long term but the monthly chart triggered a sell this month. On the weekly chart it has failed the 200 day ma and 20 day ma that intersect around 90.00. What the charts are suggesting is that there could be more rally but cotton technically has a lot going against it now since it failed to hold that consolidation it was forming for months. That is now major resistance and this rally could be an opportunity to short. Closed 79.16, up .34.
JULY ORANGE JUICE: An outside day yesterday triggered a sell today and OJ took out the recent low formed on May 8 at 112.30. Long term it continues to be negative and the next major support is down at 100.00. Closed 114.00, down 2.60.
JULY COFFEE: It triggered a buy today and rallied to 181.60. It then sold off and held at the 20 day ma. Keep stops at 175.55. Closed 178.40, up .45. Position: Long 180.20 (5.15). Projection: 185.00.
JULY COCOA: I keep trying to buy it and guess what! I’ll try again tomorrow. See Trade Alert for details. Closed 22.68, up 7. Trade Alert: Buy July cocoa. Buy 23.07 stop. Protective stop 22.33. Potential projection 25.00. (Potential risk $740. Potential reward $1350). Margin: $1930.
Reasons for the Trade:
1. On the monthly chart cocoa is back over the 100 day ma.
2. On the monthly chart cocoa has rallied over the major downtrend formed since the March 2011 high this month – suggesting a trend change from down to up.
3. The weekly chart triggered a buy last week.
4. On the weekly chart cocoa appears to be forming a second wave up since the mid Dec. low.
5. On the weekly chart cocoa is over both the major downtrend formed since the Feb. 2011 high and the 20 day ma.
5. On the daily chart a buy would put cocoa over both the 100 and 20 day ma. That would be positive.
6. On the daily chart cocoa could be starting a second wave up since the early January low.
7. On the daily chart cocoa has a previous buy signal that is still intact.
8. Today was an inside day that an trigger a signal and market direction.
JULY SUGAR: It is attempting to consolidate again but getting over 20.70 is an issue. It has been attempting to hold 20.00. That is long term support but with the monthly triggering a sell last month, I question how long it will hold. Also taking into consideration that on the weekly chart, sugar violated the 200 day ma two weeks ago isn’t exactly a case for higher prices near term. Just watching. Closed 20.40, up .13.
For additional customizable charts and quotes visit Markethead.com for a FREE, no-obligation 30 day subscription.
Judy Crawford
Call Judy Crawford toll-free at (888) 301-8120 or directly at (312) 277-0133
E-mail: jcrawford@zaner.com.
http://www.tradingfuturesmarkets.com/
Subscribe FREE to Zaner Group’s Daily Research Newsletter.
Trading commodity futures and options involves substantial risk of loss and may not be suitable for all investors. You should carefully consider whether trading is suitable for you in light of your circumstances, knowledge and financial resources. Opinions are subject to change at any time and are not a solicitation or recommendation to buy or sell futures contracts or options on futures contracts. The information contained in this message has been obtained from sources believed to be reliable but is not guaranteed as to its accuracy or completeness. All known news and events have already been factored into the price of the underlying commodities discussed.
Past performance is not indicative of future results. All suggested trades are based on technical signals/indicators and do not include slippage or cost. Not all trades suggested are taken. Results are based on what the signal indicates not necessarily an actual trade. Actual results may vary.
All suggested trades are based on technical signals/indicators and do not include slippage or cost. Not all trades suggested are taken. Results are based on what the signal indicates not necessarily an actual trade. Actual results may vary.